


Build GenAI Apps Faster with New Foundation Model Capabilities
Following the announcements we made last week about Retrieval Augmented Generation (RAG) , we're excited to announce major updates to Model Serving. Databricks...
We’re excited to announce that the latest release of sparklyr on CRAN introduces support for Databricks Connect. R users now have seamless access to Databricks clusters and Unity Catalog from remote RStudio Desktop, Posit Workbench, or any active R terminal or process. This update also opens the door for any R user to build data applications with Databricks using just a few lines of code.
This release introduces a new backend for sparklyr via the pysparklyr companion package. pysparklyr provides a bridge for sparklyr to interact with the Python Databricks Connect API. It achieves this by using the reticulate package to interact with Python from R.
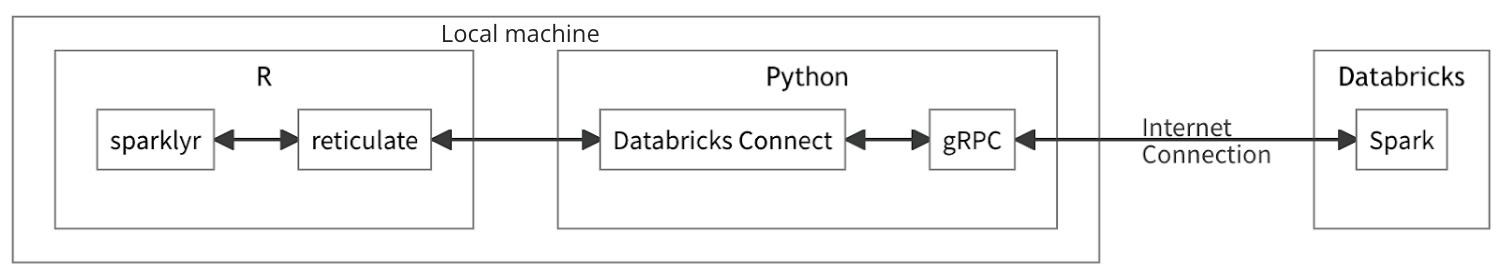
Architecting the new sparklyr backend this way makes it easier to deliver Databricks Connect functionality to R users by simply wrapping those that are released in Python. Today, Databricks Connect fully supports the Apache Spark DataFrame API, and you can reference the sparklyr cheat sheet to see which additional functions are available.
To get up and running, first install the sparklyr and pysparklyr packages from CRAN in your R session.
install.packages("sparklyr")
install.packages("pysparklyr")
Now a connection can be established between your R session and Databricks clusters by specifying your Workspace URL (aka host), access token, and cluster ID. While you can pass your credentials as arguments directly to sparklyr::spark_connect(), we recommend storing them as environment variables for added security. In addition, when using sparklyr to make a connection to Databricks, pysparklyr will identify and help install any dependencies into a Python virtual environment for you.
# This example assumes a first time connection with
# DATABRICKS_HOST and DATABRICKS_TOKEN set as environment variables
library(sparklyr)

sc <- spark_connect(
  cluster_id = "1026-175310-7cpsh3g8",
  method = "databricks_connect"
)
#> ! Retrieving version from cluster '1026-175310-7cpsh3g8'
#> Cluster version: '14.1'
#> ! No viable Python Environment was identified for Databricks Connect version 14.1
#> Do you wish to install Databricks Connect version 14.1?
#>
#> 1: Yes
#> 2: No
#> 3: Cancel
#>
#> Selection: 1
More details and tips on the initial setup can be found on the official sparklyr page.
Successfully connecting with sparklyr will populate the Connections pane in RStudio with data from Unity Catalog, making it simple to browse and access data managed in Databricks.

Unity Catalog is the overarching governance solution for data and AI on Databricks. Data tables governed in Unity Catalog exist in a three-level namespace of catalog, schema, then table. By updating the sparklyr backend to use Databricks Connect, R users can now read and write data expressing the catalog.schema.table hierarchy:
library(dplyr)
library(dbplyr)

# Read samples.nyctaxi.trips table with catalog.schema.table heirarchy
trips <- tbl(sc, in_catalog("samples", "nyctaxi", "trips"))
trips
#> # Source: spark<trips> [?? x 6]
#>    tpep_pickup_datetime tpep_dropoff_datetime trip_distance fare_amount
#>    <dttm>               <dttm>                        <dbl>       <dbl>
#>  1 2016-02-14 10:52:13  2016-02-14 11:16:04            4.94        19
#>  2 2016-02-04 12:44:19  2016-02-04 12:46:00            0.28         3.5
#>  3 2016-02-17 11:13:57  2016-02-17 11:17:55            0.7          5
#>  4 2016-02-18 04:36:07  2016-02-18 04:41:45            0.8          6
#>  5 2016-02-22 08:14:41  2016-02-22 08:31:52            4.51        17
#>  6 2016-02-05 00:45:02  2016-02-05 00:50:26            1.8          7
#>  7 2016-02-15 09:03:28  2016-02-15 09:18:45            2.58        12
#>  8 2016-02-25 13:09:26  2016-02-25 13:24:50            1.4         11
#>  9 2016-02-13 10:28:18  2016-02-13 10:36:36            1.21         7.5
#> 10 2016-02-13 18:03:48  2016-02-13 18:10:24            0.6          6
#> # ℹ more rows
#> # ℹ 2 more variables: pickup_zip <int>, dropoff_zip <int>To make interactive work with Databricks simple and familiar, sparklyr has long supported dplyr syntax for transforming and aggregating data. The newest version with Databricks Connect is no different:
# Get total trips and average trip distance, NYC Taxi dataset
trips |>
  group_by(pickup_zip) |>
  summarise(
	count = n(),
	avg_distance = mean(trip_distance, na.rm = TRUE)
  )
#> # Source: spark<?> [?? x 3]
#>   pickup_zip count avg_distance
#>        <int> <dbl>        <dbl>
#> 1      10032    15         4.49
#> 2      10013   273         2.98
#> 3      10022   519         2.00
#> 4      10162   414         2.19
#> 5      10018  1012         2.60
#> 6      11106    39         2.03
#> 7      10011  1129         2.29
#> 8      11103    16         2.75
#> 9      11237    15         3.31
#>10      11422   429        15.5
#> # ℹ more rows
#> # ℹ Use `print(n = ...)` to see more rows
In addition, when you need to debug functions or scripts that use sparklyr and Databricks Connect, the browser() function in RStudio works beautifully - even when working with enormous datasets.
Developing data applications like Shiny on top of a Databricks backend has never been easier. Databricks Connect is lightweight, allowing you to build applications that read, transform, and write data at scale without needing to deploy directly onto a Databricks cluster.
When working with Shiny in R, the connection methods are identical to those used above for development work. The same goes for working with Shiny for Python; just follow the documentation for using Databricks Connect with PySpark. To help you get started we have examples of data apps that use Shiny in R, and other frameworks like plotly in Python.
To learn more, please visit the official sparklyr and Databricks Connect documentation, including more information about which Apache Spark APIs are currently supported. Also, please check out our webinar with Posit where we demonstrate all of these capabilities, including how you can deploy Shiny apps that use Databricks Connect on Posit Connect.